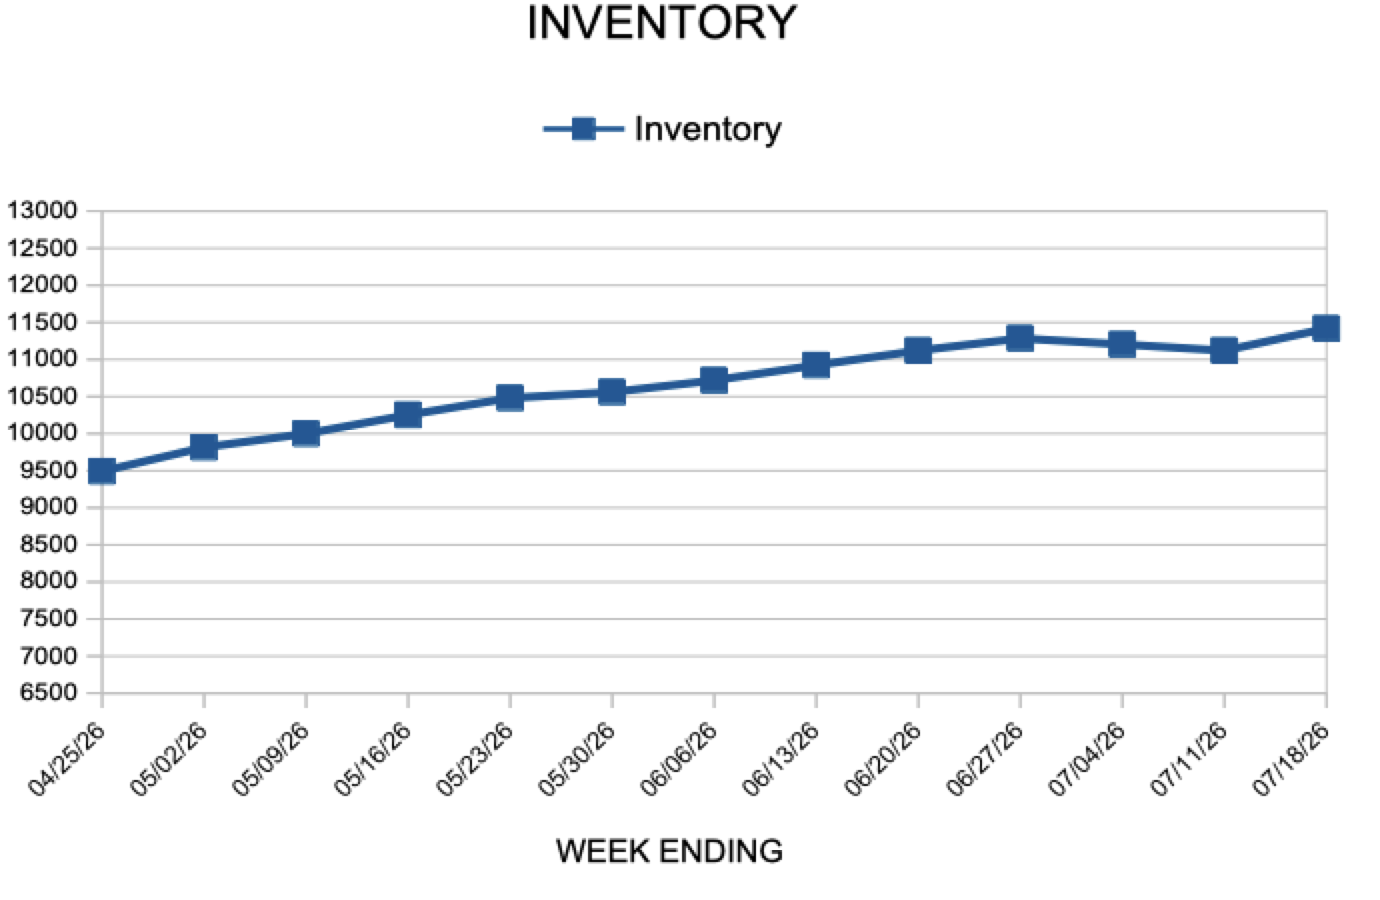
Inventory
Baby boomer homeowner households are projected to decline from approximately 32 million in 2022 to about 23 million by 2035, a net reduction of 9.2 million households, according to Freddie Mac. While baby boomers represent roughly 20% of the U.S. population, they accounted for 42% of homebuyers in 2025, according to the National Association of Realtors®, making the aging of the baby boomer generation a significant factor shaping the housing market.
In the Twin Cities region, for the week ending July 18:
For the month of June:
All comparisons are to 2025
Click here for the full Weekly Market Activity Report. From MAAR Market Data News.
A family earning the nation’s median income of $106,800 needed to spend 32% of its income to afford the mortgage payment on a median-priced home in the first quarter of 2026, according to the National Association of Home Builders (NAHB)/Wells Fargo Cost of Housing Index (CHI). That represents a modest improvement from the fourth quarter of 2025, when a family needed to spend 34% of its income on housing.
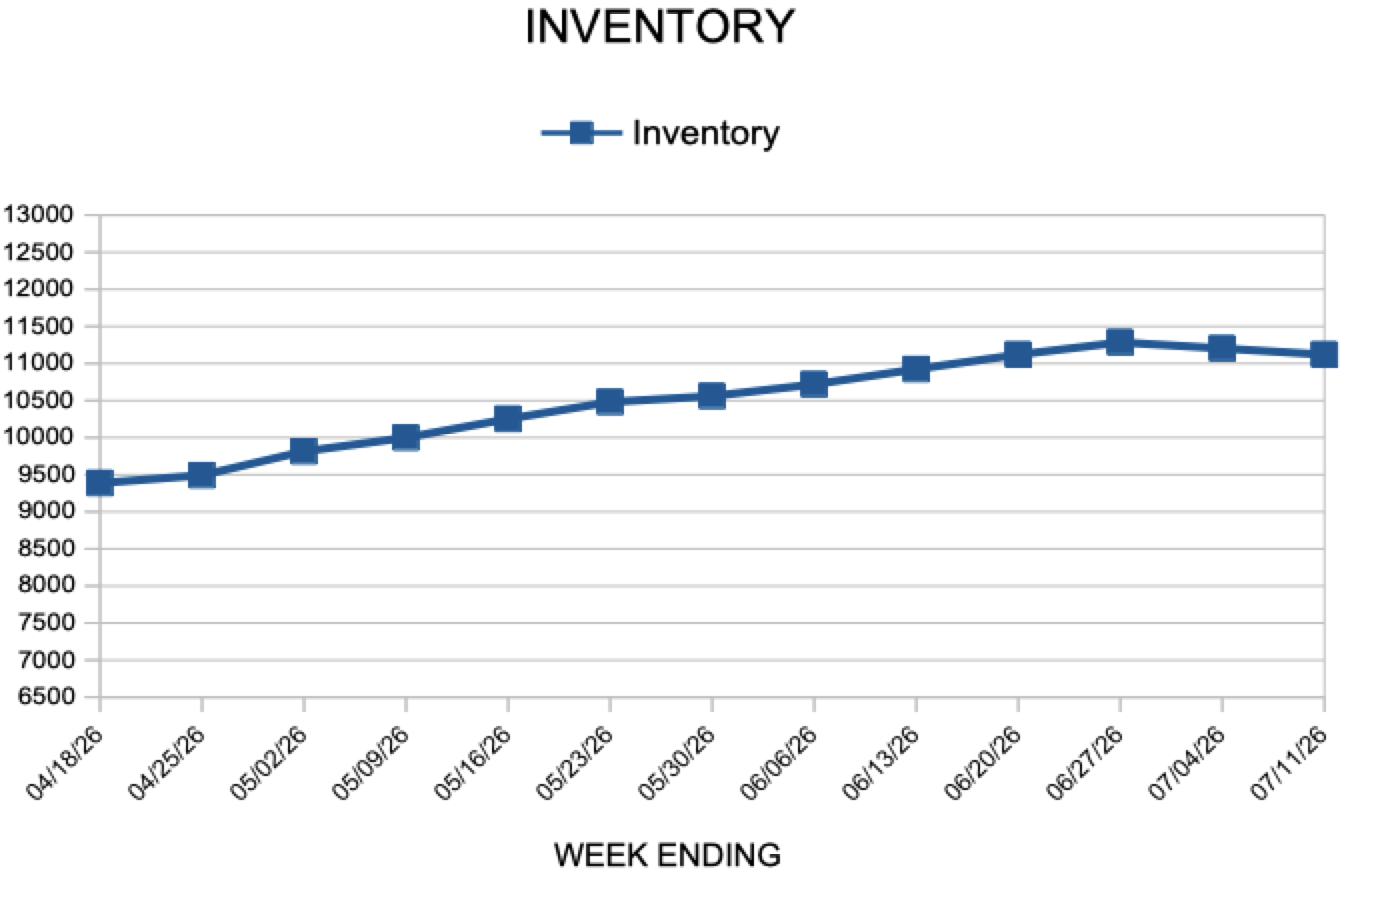
In the Twin Cities region, for the week ending July 11:
For the month of June:
All comparisons are to 2025
Click here for the full Weekly Market Activity Report. From MAAR Market Data News.
A new report from Realtor®.com found that new construction homes are more likely to sell below list price than existing homes. Condos and townhomes are also more likely to sell below list price than single-family homes. As of March 2026, the average single-family home sold for 99.2% of its final list price, while the average condo sold for 97.9% of its final list price.
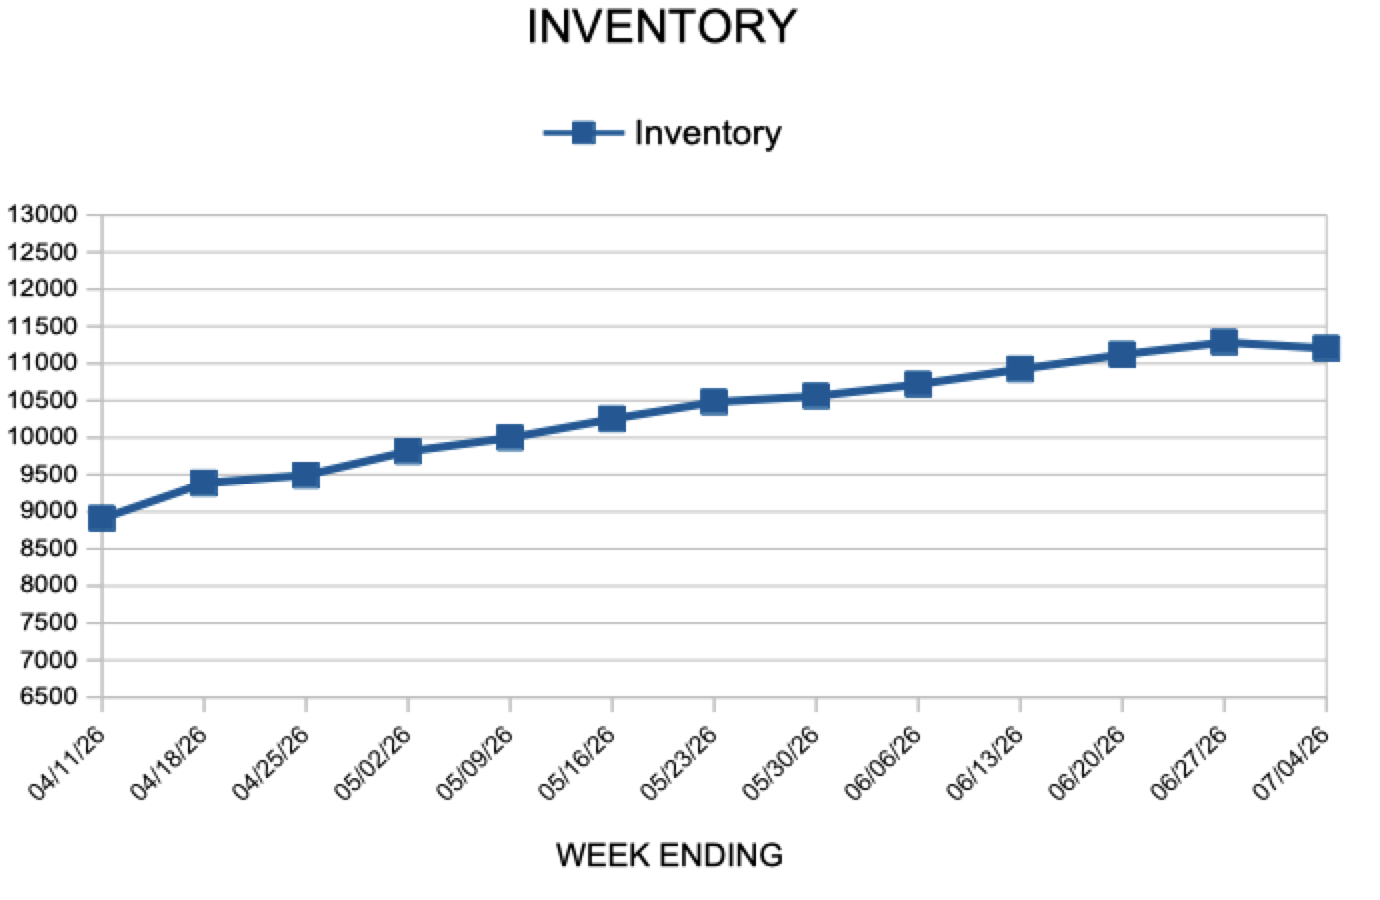
In the Twin Cities region, for the week ending July 4:
For the month of May:
All comparisons are to 2025
Click here for the full Weekly Market Activity Report. From MAAR Market Data News.