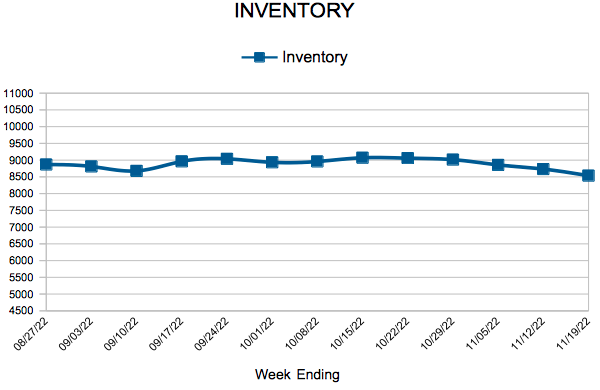
Inventory
Weekly Market Report
Single-family rents increased 10.9% year-over-year as of last measure, the fastest year-over-year increase in more than 16 years, and more than 3 times the rate of increase a year earlier, according to the CoreLogic Single-Family Rent Index (SFRI). Vacancy rates are at a 25-year low, as demand for rental units has surged this year due to skyrocketing sales prices and low inventory in the residential housing sector, leading some aspiring buyers to rent while waiting for the market to moderate.
IN THE TWIN CITIES REGION, FOR THE WEEK ENDING DECEMBER 18:
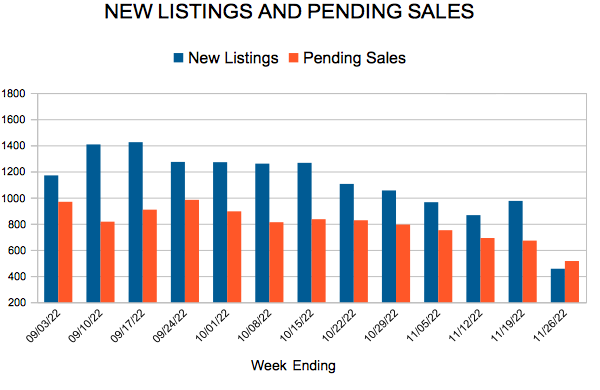
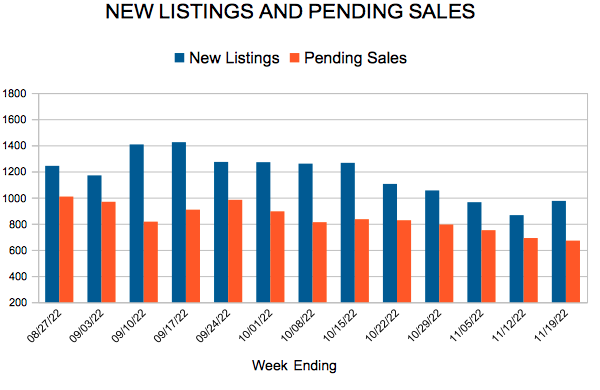
- New Listings decreased 23.5% to 565
- Pending Sales decreased 18.5% to 787
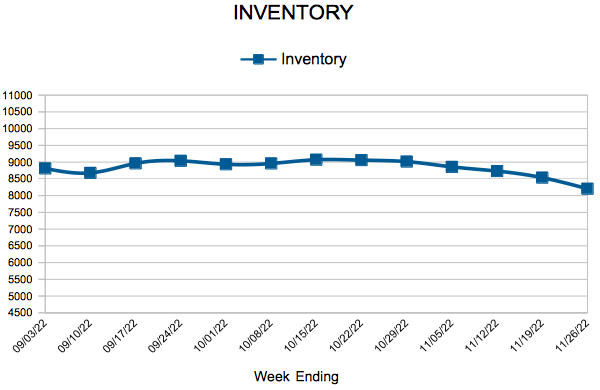
- Inventory decreased 20.8% to 5,543
FOR THE MONTH OF NOVEMBER:
- Median Sales Price increased 9.6% to $339,625
- Days on Market decreased 11.8% to 30
- Percent of Original List Price Received decreased 0.4% to 99.8%
- Months Supply of Homes For Sale decreased 21.4% to 1.1
All comparisons are to 2020
Click here for the full Weekly Market Activity Report. From MAAR Market Data News.
Despite a less frenzied marketplace, YTD figures show enduring strength
The Twin Cities just inked its 10th straight year in a metro-wide seller’s market. Relentless demand, tepid listing activity and tight inventory have driven absorption rates down to 1.1 months of supply. Four to six months of supply is considered balanced. Stable demand and rising seller activity is needed for a more balanced marketplace.“We’re seeing more gradual change and less competition compared to last November versus earlier months and we also have over 90.0 percent of 2021 in the books,” said Todd Walker, President of Minneapolis Area REALTORS®. “It looks like sales will hit a new record even as seller activity is weak and inventory is tight.” Up over 11.0 percent so far this year, home prices will also likely hit new highs. That record still hinges on December, when homes tend to take longer to sell and for a lower price. But winter months account for a smaller share of activity and thus have less impact on annual figures. The average market time in November was 30 days, but the median was 16 days. That median is up from 15 days last year. Sellers accepted, on average, 99.8 percent of their list price, down from last year, but still a strong number.
Inventory levels tumbled 18.6 percent compared to a 40.4 percent decline back in May. “While the housing shortage is still very real, there are signs that the ultra-competitive landscape is easing a bit,” according to Tracy Baglio, President of the Saint Paul Area Association of REALTORS®. “But not before we managed to post a new record for closings through November. I expect this to continue as rates remain attractive.”
Market activity varies by area, price point and property type. Home sales doubled in the Cleveland, Windom, Corcoran and Hawthorne neighborhoods, but fell over 50.0 percent in Cooper, Hale and Jordan. Sales in Falcon Heights, Delano, North Branch and Mendota Heights rose over 80.0 percent but fell over 50.0 percent in Wayzata, Medina and Wyoming. Home sales over $1M rose 43.6 percent over the last 12 months. Sales between $150,000 and 190,000 dropped 31.0 percent. Sales in Minneapolis reached their second highest level since 2005. Though a small share overall, condo sales increased more than single family and townhome units.
November 2021 by the numbers compared to a year ago
- Sellers listed 4,123 properties on the market, a 1.2 percent increase from last November
- Buyers signed 4,740 purchase agreements, up 0.8 percent (5,536 closed sales, down 3.0 percent)
- Inventory levels fell 18.6 percent to 6,110 units
- Month’s Supply of Inventory was down 21.4 percent to 1.1 months (4-6 months is balanced)
- The Median Sales Price rose 9.4 percent to $339,000
- Days on Market fell 11.8 percent to 30 days, on average (median of 16 days, up 6.7 percent from November 2020)
- Changes in Sales activity varied by market segment
- Condo sales rose 14.7 percent, single family sales fell 0.9 percent & townhouse sales rose 4.6 percent
- Traditional sales were up 1.5 percent; foreclosure sales were down 52.9 percent; short sales fell 22.2 percent
- Previously owned sales increased 4.1 percent; new construction sales decreased by 19.2 percent
November Monthly Skinny Video
Months’ supply of inventory was down 21.4 percent since last year at 1.1 months. That’s well below the 5 months that’s considered balanced. Percent of List Price Received at Sale remained at 100.7 percent since last year.
Existing Home Sales
- « Previous Page
- 1
- …
- 113
- 114
- 115
- 116
- 117
- …
- 135
- Next Page »